Mapping out COVID-19
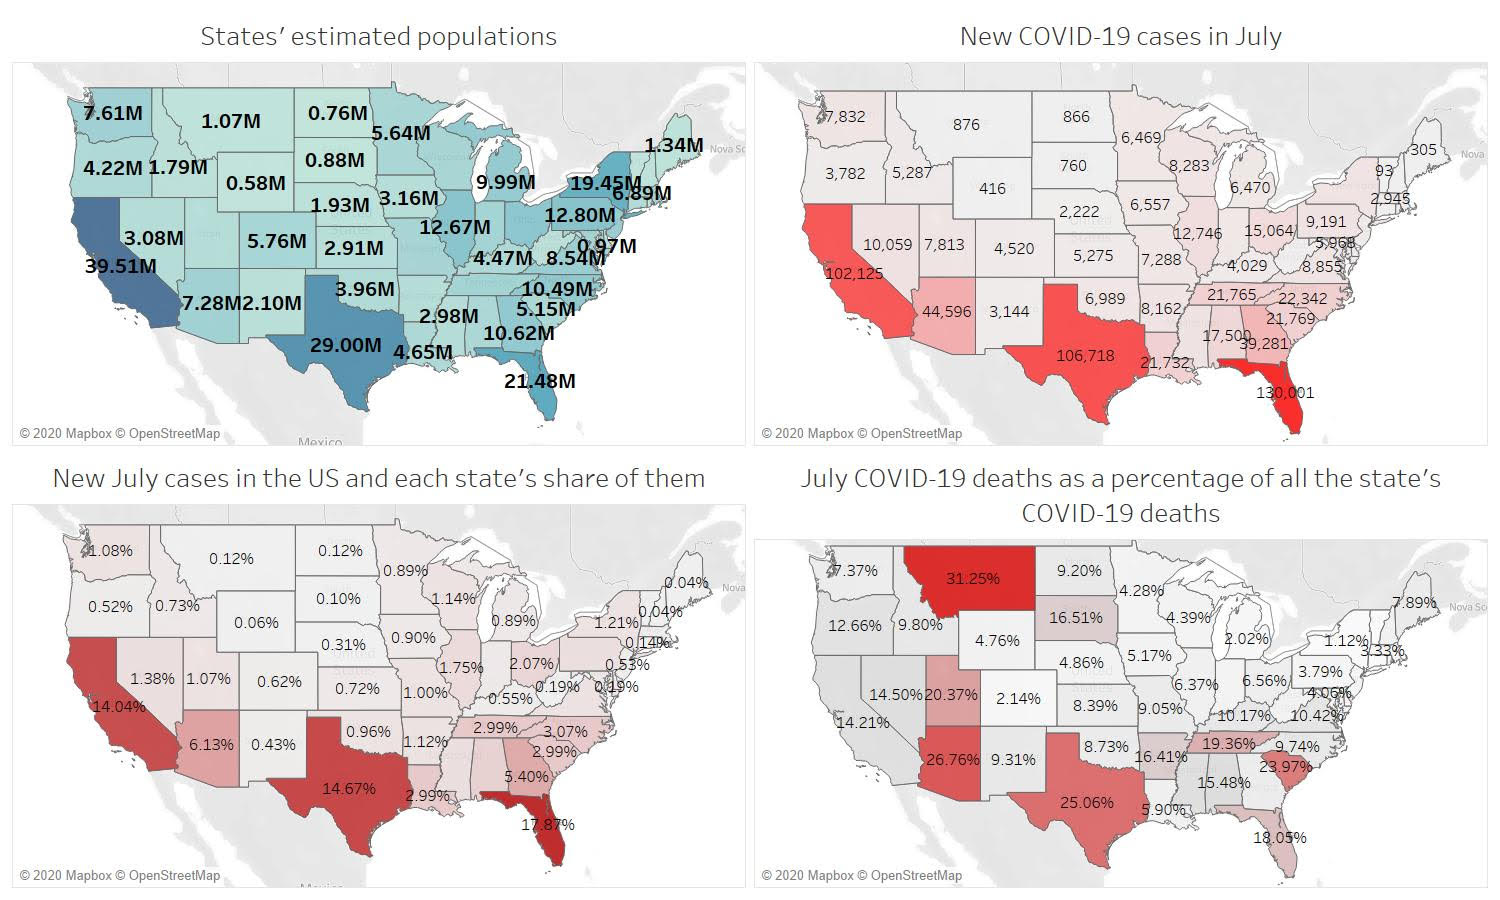
July 14. These four graphs use Johns Hopkins’ data along with US Census Bureau data.
Map 1 (top left) indicates the estimated populations per state with North Carolina at around 10.49 million or 3.2 percent of the United States’ population.
Map 2 (top right) indicates the number of new cases each state had in July. North Carolina has had 22,342 to date according to Johns Hopkins’ Center for Systems Science and Engineering.
Map 3 (bottom left) shows the percentage of national cases in July that each state shares. North Carolina accounts for 3.07 percent of the national cases in July, falling slightly below the state’s share of the national population.
Map 4 (bottom right) shows the percentage of deaths due to COVID-19 that each state has experienced in July compared to all of the state’s COVID-19 deaths.
According to NCDHHS (https://www.ncdhhs.gov/news/press-releases/north-carolina-identifies-first-case-covid-19), the first case of COVID-19 occurred on March 3.
The span from March 3 until July 13 is 132 days. 13 days in July accounts for 9.8 percent of those 132 days, which falls in line with 9.74 percent of COVID-19 deaths occurring in July to date.